

Economy of the Philippines
| Currency | Philippine peso (Filipino: piso; sign: ₱; code: PHP) |
|---|---|
| Calendar year | |
Trade organizations | ADB, AIIB, AFTA, APEC, ASEAN, EAS, G-24, RCEP, WTO and others |
Country group | |
| Statistics | |
| Population | Neutral increase 112,729,484 (2024)[3] |
| GDP | |
| GDP rank | |
GDP per capita | |
GDP per capita rank | |
| 3.6% (2025)[5] | |
GDP by sector |
|
GDP by component |
|
| Positive decrease 6.1% (August 2026)[7] | |
Population below national poverty line |
|
| Positive decrease 39.3 medium (2023)[10] | |
| Decrease 33 out of 100 points (2024, 114th rank) | |
Labor force | |
Labor force by occupation |
|
| |
Average gross salary | ₱21,544 / US$376 monthly (2024)[13] |
| ₱20,559 / US$358 monthly (2024) | |
| Gross savings | Increase ₱8.40 trillion (2025)[14] |
Main industries | |
| External | |
| Exports | $116.52 billion (2023)[17][6][note 1] |
Export goods |
|
Main export partners |
|
| Imports | $159.29 billion (2022)[17][6][note 1] |
Import goods |
|
Main import partners | |
FDI stock | |
| |
Gross external debt |
|
| Public finance | |
| |
| Increase $104.81 billion (August 2026)[21][23] | |
| |
| |
| |
| Economic aid | recipient: Increase $41.84 billion (2025)[24][25][a] |
| |
All values, unless otherwise stated, are in US dollars. | |


The economy of the Philippines is an emerging market, and considered as a newly industrialized country in the Asia-Pacific region.[30] In 2026, the Philippine economy is estimated to be at ₱30.22 trillion ($512.22 billion), making it the world's 35th largest by nominal GDP and 14th largest in Asia according to the International Monetary Fund.
The Philippine economy is a service-oriented economy, with relatively more modest contributions from the manufacturing and agriculture sectors. It has experienced significant economic growth and transformation in the past, posting one of the highest GDP growth rates in Asia. With an average annual growth rate of around 6 percent since 2010, the country has emerged as one of the fastest-growing economies in the world.[31] The Philippines is a founding member of the United Nations, Association of Southeast Asian Nations, Asia-Pacific Economic Cooperation, East Asia Summit and the World Trade Organization.[32] The Asian Development Bank (ADB) is headquartered in the Ortigas Center located in the city of Mandaluyong, Metro Manila.
The country's primary exports include semiconductors and electronic products, transport equipment, garments, chemical products, copper, nickel, abaca, coconut oil, and fruits. Its major trading partners include Japan, China, the United States, Singapore, South Korea, the Netherlands, Hong Kong, Germany, Taiwan, and Thailand. In 2017, the Philippine economy was projected to become the 9th largest in Asia and 19th largest in the world by 2050.[33] By 2035, the Filipino economy is predicted to be the 22nd largest in the world.[34]
The Philippines has been named as one of the Tiger Cub Economies, alongside Indonesia, Malaysia, Vietnam, and Thailand. However, major problems remain, mainly related to alleviating the wide income and growth disparities between the country's different regions and socioeconomic classes, reducing corruption, and investing in the infrastructure necessary to ensure future growth. In 2024, the World Economic Forum chief Børge Brende said that "there is a real opportunity for this country to become a $2-trillion economy."[35]
The Philippines exhibits one of the highest economic densities in Southeast Asia, characterized by a high concentration of economic output relative to its land area. As of 2024–2025, the Philippines ranks third among ASEAN nations in GDP Density (Nominal GDP per square kilometer), trailing only the city-state of Singapore and the resource-rich sultanate of Brunei.[36] This is so, because there is such large economic activity that is happening on such low amount of land area that's scattered amongst a fragmented archipelagic geography. This is expressed in the concept called GDP density.[37][38]
In 2025, the Philippines enacted Republic Act No. 12252, amending the Investors’ Lease Act to allow foreign investors to lease private land for up to 99 years, up from the previous limit of 75 years (50 + 25 extension). This reform aims to enhance the country's competitiveness in attracting long-term foreign direct investment by offering greater leasehold security for commercial and industrial projects.[39] A project called the "Luzon Economic Corridor" is on the works, which will further develop the Philippine economy.[40] It is the first country in the world to put its entire national budget under blockchain technology.[41]
Composition by sector
As a newly industrialized country, the Philippines is still an economy with a large agricultural sector; however, the country's service industry has expanded recently.[42] Much of the industrial sector is based on processing and assembly operations in the manufacturing of electronics and other high-tech components, usually from foreign multinational corporations.
Filipinos who go abroad to work–-known as Overseas Filipino Workers or OFWs—are a significant contributor to the economy but are not reflected in the below sectoral discussion of the domestic economy. OFW remittances is also credited for the Philippines' recent economic growth resulting in investment status upgrades from credit ratings agencies such as the Fitch Group and Standard & Poor's.[43] From more than US$2 billion worth of remittance from Overseas Filipinos sent to the Philippines in 1994,[44] this significantly increased to a record US$38.34 billion in 2024 and represented 8.3 percent of the country's GDP.[45]
Agriculture, aquaculture and forestry
As of 2022[update], agriculture employs 24 percent of the Filipino workforce[46] accounting for 8.9 percent of the total GDP.[47] The type of activity ranges from small subsistence farming and fishing to large commercial ventures with significant export focus.
The Philippines is the world's third largest producer of coconuts, and the world's largest exporter of coconut products.[48] Coconut production is generally concentrated in medium-sized farms.[49] The Philippines is also the world's third largest producer of pineapples, producing 2,862,000 metric tons (2,817,000 long tons; 3,155,000 short tons) in 2021.[50]
Rice production in the Philippines is important to the food supply in the country and economy. The Philippines is the 7th largest rice producer in the world as of the 1st half of 2026, accounting for 2 percent of global rice production.[51] Rice is the most important food crop, a staple food in most of the country;[52] it is produced extensively in Central Luzon), Western Visayas, Cagayan Valley, Soccsksargen, and Ilocos Region.[53][54]
The Philippines is one of the largest producers of sugar in the world.[55] At least 17 provinces located in eight regions of the nation have grown sugarcane crops, of which the Negros Island Region accounts for half of the country's total production. As of Crop Year 2012–2013, 29 mills are operational divided as follows: 13 mills in Negros, 6 mills in Luzon, 4 mills in Panay, 3 mills in Eastern Visayas and 3 mills in Mindanao.[56] A range from 360,000 to 390,000 hectares (890,000 to 960,000 acres) are devoted to sugarcane production. The largest sugarcane areas are found in the Negros Island Region, which accounts for 51 percent of sugarcane areas planted. This is followed by Mindanao which accounts for 20 percent; Luzon with 17 percent; Panay with 7 percent and Eastern Visayas with 4 percent.[57]
Blue economy
As an archipelagic country, the Philippines relies heavily on the blue economy. Its main ocean-based sectors are fisheries, shipping, offshore renewable energy, and marine tourism. The blue economy made up nearly 4 percent of the country's gross domestic product (PHP1 trillion) in 2024. Although important for the country's economic growth, only 2 percent of the development aid the country receives is directed to the blue economy.[58]
Mangrove forests, which cover more than 1% of the country's land area, provide a wide range of benefits its coastal communities and blue economy. By providing food and shelter, mangroves function as breeding and nursery grounds for fish. In effect, this leads to a higher abundance of fish, crustaceans, and shellfish around these areas which local small-scale fisheries rely on for food and livelihood.[59] Mangrove forests also help mitigate climate change by absorbing carbon from the atmosphere, and offer locals protection from natural hazards such as tropical cyclones, and reduce coastal erosion by strengthening the soil.[58] 22% of mangroves in the Philippines can be found in Palawan where local livelihoods rely on them as fishing grounds, for harvesting mangrove honey, and as a site for ecotourism.[60]
Automotive and aerospace
The ABS used in Mercedes-Benz, BMW, and Volvo cars are made in the Philippines. Automotive sales in the Philippines increased to 467,252 in 2024 from 429,807 units a year prior.[61] Toyota sells the most vehicles in the country followed by Mitsubishi, Ford, Nissan, and Suzuki.[61] Honda and Suzuki produce motorcycles in the country.[62] Since around the 2010s, several Chinese car brands have entered the Philippine market; these include Chery and Foton Motor.[63][64]
Aerospace products in the Philippines are mainly for the export market and include manufacturing parts for aircraft built by both Boeing and Airbus. Moog is the biggest aerospace manufacturer with base in Baguio; the company produces aircraft actuators in their manufacturing facility.[65] Total export output of aerospace products in the Philippines reached US$780 million in 2019.[66]
Electronics
A Texas Instruments plant in Baguio has been operating for 20 years and is the largest producer of DSP chips in the world.[67][68] Texas Instruments' Baguio plant produces all the chips used in Nokia cell phones and 80% of chips used in Ericsson cell phones in the world.[69] Toshiba hard disk drives are manufactured in Santa Rosa, Laguna.[70] Printer manufacturer Lexmark has a factory in Cebu City.[71] Electronics and other light industries are concentrated in Laguna, Cavite, Batangas and other Calabarzon provinces with sizable numbers found in Southern Philippines that account for most of the country's export.[72]
The Philippine Electronics Industry is classified into (73%) Semiconductor Manufacturing Services (SMS) and (27%) Electronics Manufacturing Services (EMS) according to SEIPI, the largest organization of foreign and Filipino electronics companies in the Philippines.[73] Electronic products continued to be the country's top export with total earnings of US$45.66 billion and accounted for 57.8 percent of the total export of goods in 2022.[74]
Semiconductor
The semiconductor industry plays a critical role in the Philippine economy by integrating the Philippines into the global electronics value chain. The country is primarily involved in the assembly, testing, and packaging stages of semiconductor production rather than chip design or wafer fabrication, serving as a key link in the global supply chain for electronic components.[75]
According to the Semiconductor and Electronics Industries in the Philippines Foundation (SEIPI), semiconductor manufacturing services account for the majority of the country’s electronics industry output. Semiconductor products are widely used in consumer electronics, telecommunications equipment, automotive systems, and industrial applications.[76]
Semiconductor manufacturing facilities in the Philippines are largely operated by multinational firms and are concentrated in major industrial zones, particularly in the CALABARZON region as well as parts of Central Luzon and the Visayas. The industry benefits from a skilled technical workforce, competitive production costs, and government investment incentives.
As part of the broader electronics sector, semiconductors contribute significantly to export earnings, employment generation, and foreign direct investment. The industry also supports technology transfer and skills development, reinforcing its role as one of the Philippines’ most important high-technology manufacturing sectors.[77]
Mining and extraction
Philippine gold, nickel, copper, palladium and chromite deposits are among the largest in the world.[78][79] Other important minerals include silver, coal, gypsum, and sulphur. Significant deposits of clay, limestone, marble, silica, and phosphate exist.
About 60 percent of total mining production are accounted for by non-metallic minerals, which contributed substantially to the industry's steady output growth between 1993 and 1998, with the value of production growing 58 percent.[citation needed] Philippine mineral exports amounted to US$4.22 billion in 2020.[80] Low metal prices, high production costs, lack of investment in infrastructure, and a challenge to the new mining law have contributed to the mining industry's overall decline.[citation needed]
The industry rebounded starting in late 2004 when the Supreme Court upheld the constitutionality of an important law permitting foreign ownership of Philippines mining companies.[81] In 2019, the country was the 2nd largest world producer of nickel[82] and the 4th largest world producer of cobalt.[83] According to Philippine Statistics Authority, the total monetary value of four key metallic minerals which were appraised to Class A namely: copper, chromite, gold and nickel were valued at US$10.23 billion in 2025.[84] Class A mineral resources are commercially recoverable that could contribute to economy annually.
Offshoring and outsourcing
Business process outsourcing (BPO) and the call center industry contribute to the Philippines' economic growth resulting in investment status upgrades from credit ratings agencies such as Fitch and S&P.[43] In 2008, the Philippines has surpassed India as the world leader in business process outsourcing (BPO).[85][86] The industry generated 100,000 jobs, and total revenues were placed at US$960 million for 2005. In 2011, BPO sector employment ballooned to over 700,000 people[87] and is contributing to a growing middle class; this increased to around 1.3 million employees by 2022.[88] BPO facilities are concentrated in IT parks and centers in economic zones across the Philippines:[89] Metro Manila, Metro Cebu, Metro Clark, Bacolod, Davao City, and Iloilo City; other areas with significant presence of the BPO industry include Baguio, Cagayan de Oro, Dasmariñas, Dumaguete, Lipa, Naga, and Santa Rosa, Laguna.[90] The majority of the top ten BPO firms of the United States operate in the Philippines.[91]
Call centers began in the Philippines as plain providers of email response and managing services and is a major source of employment. Call center services include customer relations, ranging from travel services, technical support, education, customer care, financial services, online business to customer support, and online business-to-business support. The Philippines is considered as a location of choice due to its many outsourcing benefits such as less expensive operational and labor costs, the high proficiency in spoken English of a significant number of its people, and a highly educated labor pool.[92][93]
The growth in the BPO industry is promoted by the Philippine government. The industry is highlighted by the Philippines Development Plan as among the 10 high potential and priority development areas. The government provides incentive programs such as tax holidays, tax exemptions, and simplified export and import procedures. Additionally, training is also available for BPO applicants.[94]
Shipbuilding and repair
The Philippines is a significant player in the global shipbuilding industry[95] with 118 registered shipyards in 2021[96] distributed in Subic, Cebu,[97] Bataan, Navotas and Batangas.[98][99] As of 2022, it is the seventh largest shipbuilding nation by gross tonnage.[100] Subic-made cargo vessels are exported to countries where shipping operators are based. South Korea's Hanjin started production in Subic in 2007 of the 20 ships ordered by German and Greek shipping operators.[101] Bulk carriers, container ships and big passenger ferries are built in the country's shipyards. General Santos' shipyard is mainly for ship repair and maintenance.[102]
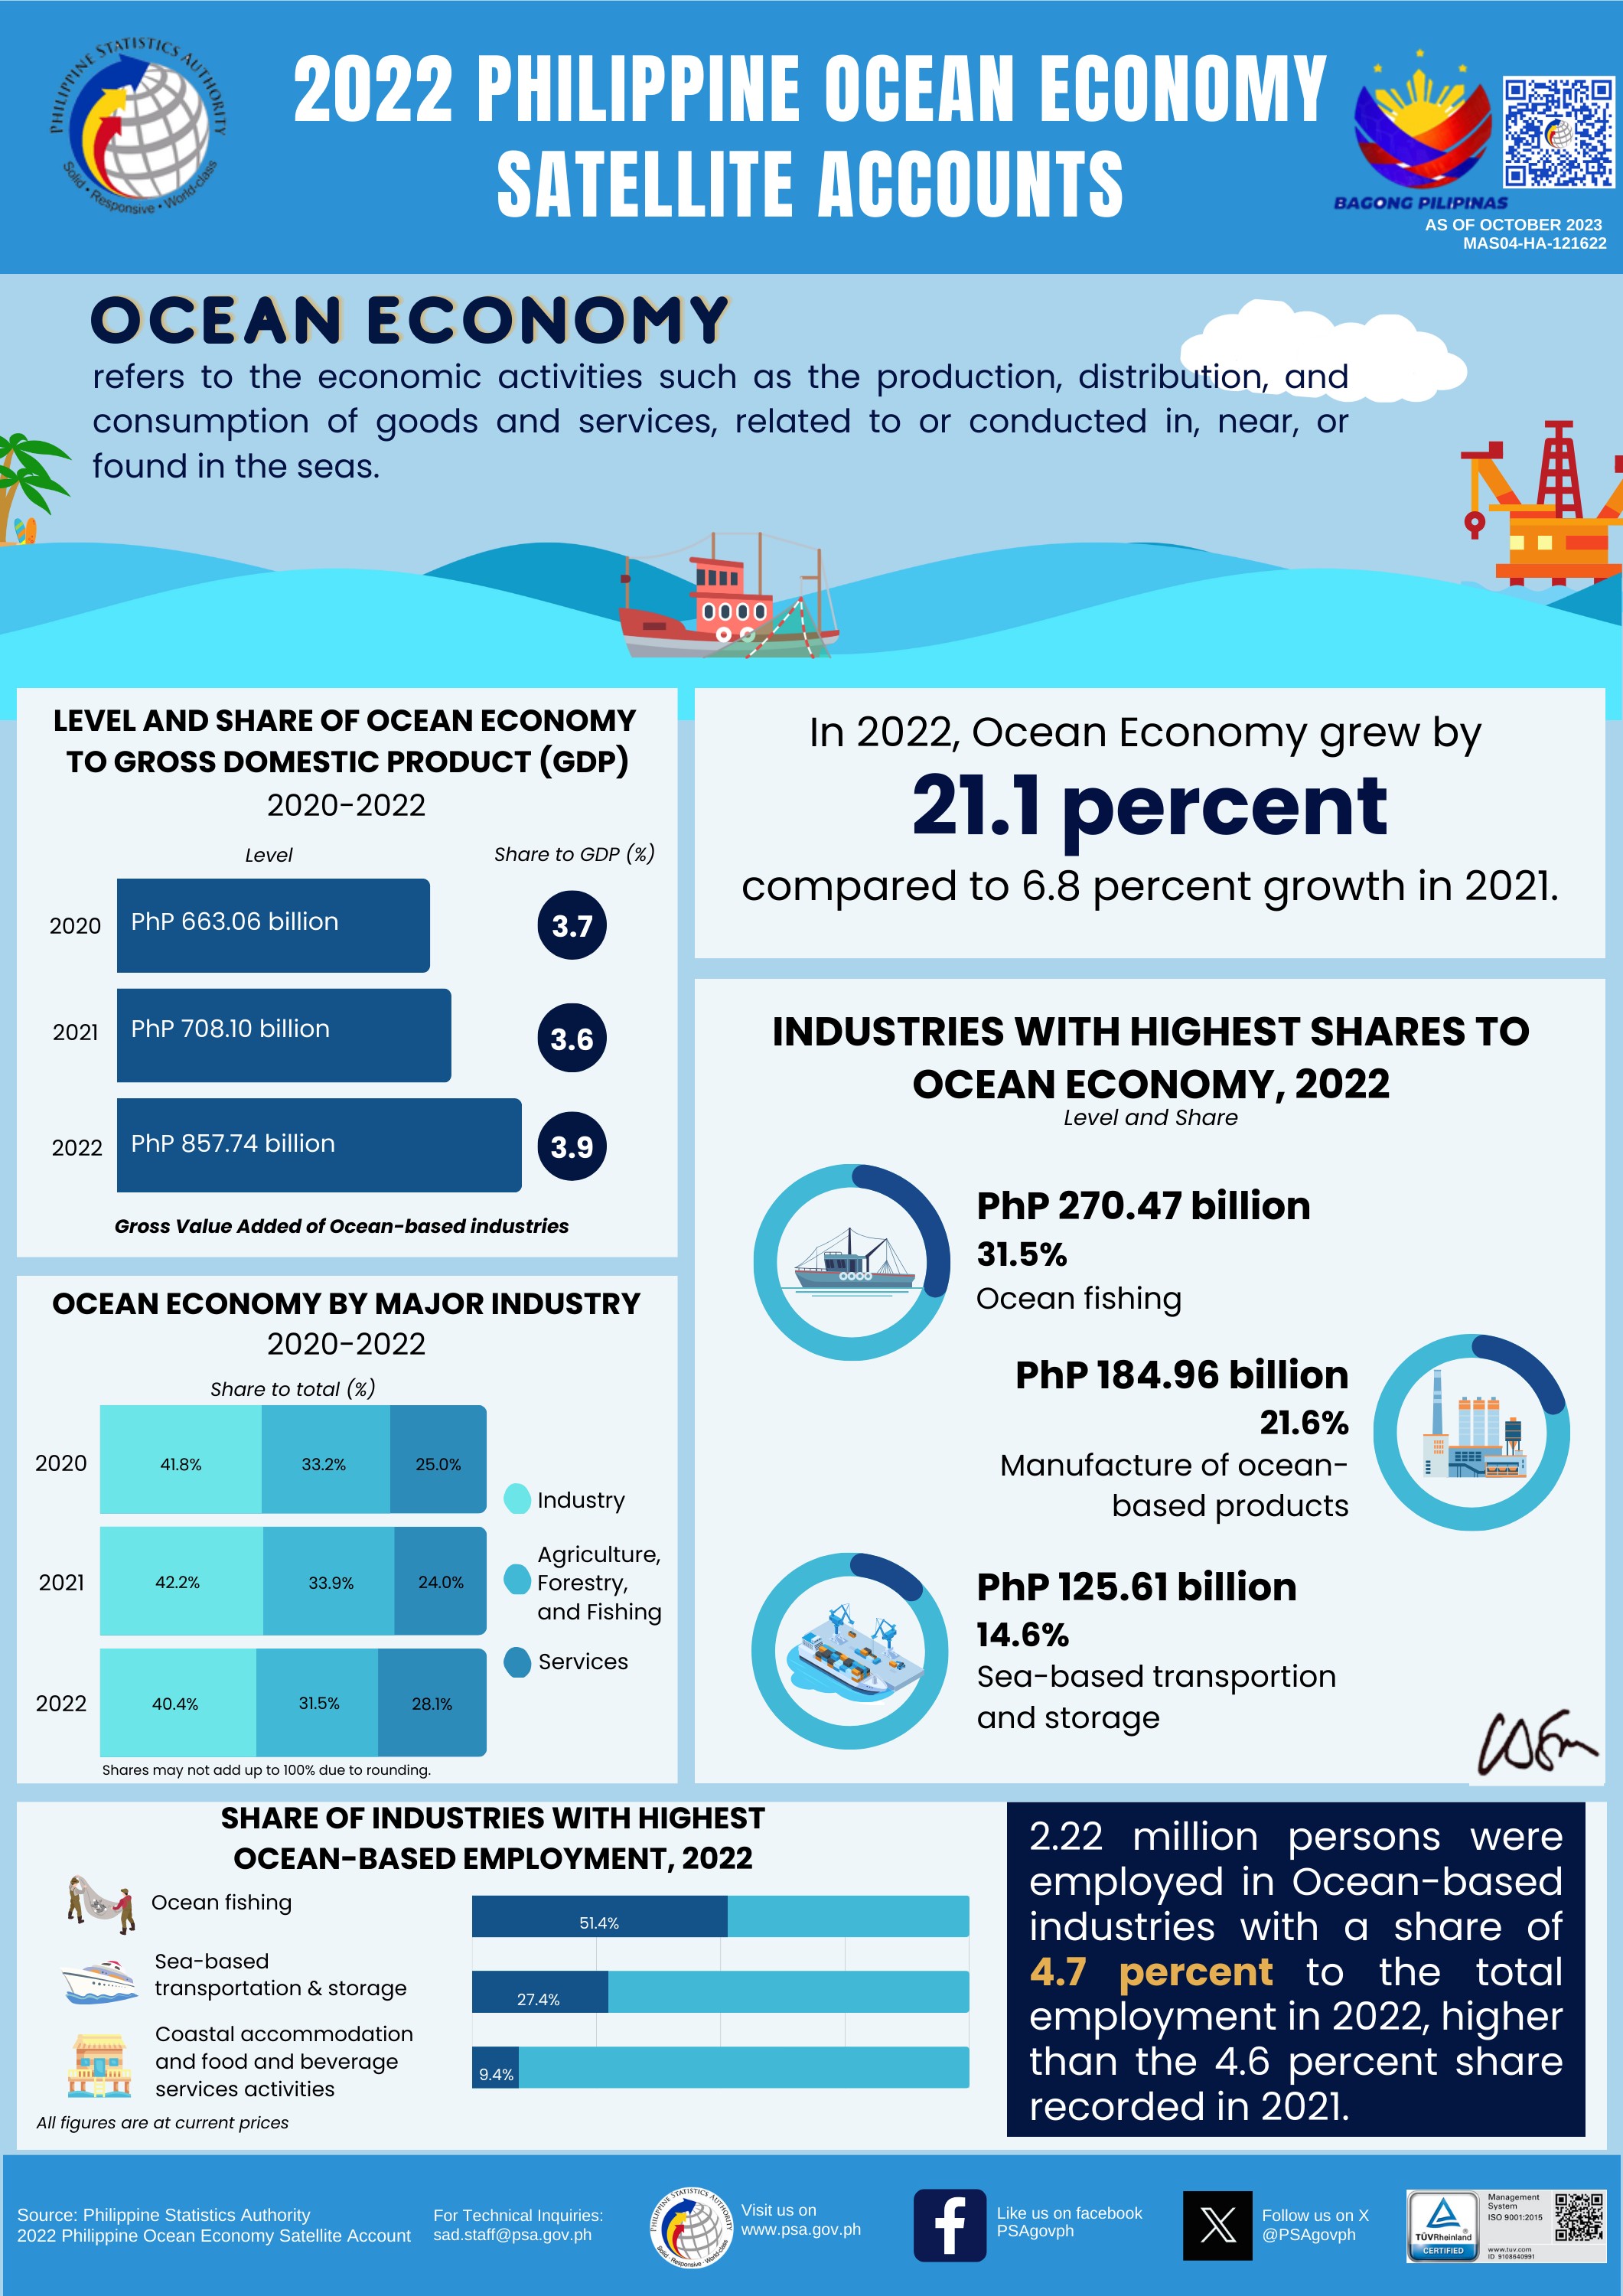
Surrounded by waters, the country has abundant natural deep-sea ports ideal for development as production, construction and repair sites. In the ship repair sector, the Navotas complex in Metro Manila is expected to accommodate 96 vessels for repair.[103] Shipbuilding is part of Philippines' maritime heritage;[104] employing over 600,000 people and contributing almost 15 percent of revenues to the ocean-based industries.[105][106]
Construction and real estate
Banking and finance
Education
Healthcare
Retail
Tourism
Infrastructure
Energy
The Philippines is rich in mineral and geothermal energy resources. In 2019, it produced 1,928 megawatts (2,585,000 hp) of electricity from geothermal sources (7.55% of total electricity production).[107] A 1989 discovery of natural gas reserves in the Malampaya oil fields off the island of Palawan is being used to generate electricity in three gas-powered plants.[108]
The Philippines has significant potential in solar energy; however, as of 2021[update], most of the domestically produced electricity is based on fossil fuel resources, particularly coal.[109][110] The country produced 7,399 megawatts (9,922,000 hp) of renewable energy in 2019.[107]
On November 15, 2022, the renewable energy sector was granted the ability to operate with 100 percent foreign ownership, an increase from the previous 40 percent limit. This change allows for the infusion of foreign capital into the renewable energy (RE) industries. The Department of Energy is targeting an increase in the share of renewable energy in the country's power generation mix, aiming for 35 percent by 2030 and 50 percent by 2040, up from the current 22 percent.[111] Danish firm Copenhagen Infrastructure Partners (CIP) is investing US$5 billion to develop three offshore wind energy projects with a potential capacity of 2,000 megawatts (2,700,000 hp); it will be located in Camarines Norte and Camarines Sur (1000 MW), Northern Samar (650 MW), Pangasinan and La Union (350 MW).[112] In 2022, the share of RE in the energy mix was at 22.8 percent.[113]
Telecommunications
Transport
Labor, income and welfare
Regional accounts
For the year 2022, all economies of the 17 regions in the Philippines recorded positive growths; Western Visayas had the highest growth (9.3 percent), followed by Cordillera Administrative Region (8.7 percent), and Davao Region (8.15 percent).[114]
According to the Philippine Statistics Authority (PSA), gross regional domestic product (GRDP) is GDP measured at regional levels. Figures below are for the year 2019.
| Region | GRDP
(PHP, thousands) |
Agriculture
(PHP, thousands) |
Industry
(PHP, thousands) |
Services
(PHP, thousands) |
GRDP per capita (PHP) | ||||
|---|---|---|---|---|---|---|---|---|---|
| # | % | # | % | # | % | # | % | ||
| Metro Manila | 6,309,290,637 | 32.33 | 442,597 | 0.03 | 1,230,125,141 | 20.89 | 5,078,722,899 | 42.65 | 462,779 |
| Cordillera | 322,093,866 | 1.65 | 27,045,337 | 1.57 | 77,990,725 | 1.32 | 217,057,804 | 1.82 | 179,752 |
| Ilocos Region | 629,772,047 | 3.23 | 104,471,256 | 6.07 | 192,218,332 | 3.26 | 333,082,459 | 2.80 | 120,512 |
| Cagayan Valley | 397,625,523 | 2.04 | 103,563,850 | 6.01 | 115,614,177 | 1.96 | 178,447,496 | 1.50 | 109,851 |
| Central Luzon | 2,177,046,900 | 11.15 | 231,995,441 | 13.47 | 950,969,430 | 16.15 | 994,082,029 | 8.35 | 179,840 |
| Calabarzon | 2,861,724,791 | 14.66 | 154,312,287 | 8.96 | 1,445,358,775 | 24.55 | 1,262,053,729 | 10.60 | 181,781 |
| Mimaropa | 377,014,287 | 1.93 | 64,116,478 | 3.72 | 125,427,469 | 2.13 | 187,470,340 | 1.57 | 120,240 |
| Bicol Region | 560,314,934 | 2.87 | 85,820,150 | 4.98 | 202,529,524 | 3.44 | 271,965,260 | 2.28 | 92,288 |
| Western Visayas | 916,379,059 | 4.70 | 144,256,702 | 8.38 | 194,479,931 | 3.30 | 577,642,425 | 4.85 | 116,946 |
| Central Visayas | 1,266,701,029 | 6.49 | 79,478,668 | 4.61 | 342,195,668 | 5.81 | 845,026,693 | 7.10 | 161,289 |
| Eastern Visayas | 465,694,628 | 2.39 | 61,219,158 | 3.55 | 181,914,842 | 3.09 | 222,560,628 | 1.87 | 99,492 |
| Zamboanga Peninsula | 397,206,561 | 2.04 | 74,695,151 | 4.34 | 110,467,600 | 1.88 | 212,043,810 | 1.78 | 105,798 |
| Northern Mindanao | 882,204,432 | 4.52 | 182,955,342 | 10.62 | 208,580,211 | 3.54 | 490,668,878 | 4.12 | 177,998 |
| Davao Region | 922,094,956 | 4.72 | 149,438,384 | 8.68 | 233,452,398 | 3.97 | 539,204,175 | 4.53 | 176,983 |
| Soccsksargen | 470,422,524 | 2.41 | 130,802,115 | 7.60 | 103,321,113 | 1.75 | 236,299,297 | 1.98 | 108,561 |
| Caraga | 306,308,490 | 1.57 | 39,908,783 | 2.32 | 109,464,024 | 1.86 | 156,935,683 | 1.32 | 112,489 |
| Bangsamoro | 254,523,606 | 1.30 | 87,689,432 | 5.09 | 63,191,105 | 1.07 | 103,643,069 | 0.87 | 55,151 |
| Total | 19,516,418,271 | 100.00 | 1,722,211,131 | 100.00 | 5,887,300,465 | 100.00 | 11,906,906,674 | 100.00 | 181,907 |
| Data as of October 21, 2020[115] | |||||||||
Provincial accounts
According to the Philippine Statistics Authority (PSA), Provincial Product Account (PPA) is GDP measured at provincial levels. Figures below are for the year 2022.
| # | Province | Region | 2022 PPA GDP
(PHP) |
2020
Popn. |
PPA GDP
per capita (PHP) |
|---|---|---|---|---|---|
| 1 | Metro Manila | Metro Manila | 6,265,608,000,000 | 13,484,462 | 464,654 |
| 2 | Laguna | Calabarzon | 990,690,000,000 | 3,382,193 | 292,914 |
| 3 | Cebu (incl. Cebu City, Lapu-Lapu City & Mandaue) | Central Visayas | 937,750,000,000 | 5,151,274 | 182,042 |
| 4 | Cavite | Calabarzon | 731,390,000,000 | 4,344,829 | 168,336 |
| 5 | Pampanga (incl. Angeles City) | Central Luzon | 658,070,000,000 | 2,900,637 | 226,871 |
| 6 | Batangas | Calabarzon | 615,810,000,000 | 2,908,494 | 211,728 |
| 7 | Bulacan | Central Luzon | 604,710,000,000 | 3,708,890 | 163,043 |
| 8 | Davao del Sur (incl. Davao City) | Davao Region | 599,000,000,000 | 2,457,430 | 243,751 |
| 9 | Misamis Oriental (incl. Cagayan de Oro) | Northern Mindanao | 419,220,000,000 | 1,685,302 | 248,751 |
| 10 | Negros Occidental (incl. Bacolod) | Western Visayas | 379,200,000,000 | 3,223,955 | 117,620 |
| 11 | Pangasinan | Ilocos Region | 352,930,000,000 | 3,163,190 | 111,574 |
| 12 | Iloilo (incl. Iloilo City) | Western Visayas | 351,050,000,000 | 2,509,525 | 139,887 |
| 13 | Rizal | Calabarzon | 340,630,000,000 | 3,330,143 | 102,287 |
| 14 | Nueva Ecija | Central Luzon | 298,570,000,000 | 2,310,134 | 129,244 |
| 15 | Leyte (incl. Tacloban) | Eastern Visayas | 296,950,000,000 | 2,028,728 | 146,373 |
| 16 | Quezon (incl. Lucena) | Calabarzon | 264,460,000,000 | 2,229,383 | 118,625 |
| 17 | South Cotabato (incl. General Santos) | Soccsksargen | 263,830,000,000 | 1,672,791 | 157,718 |
| 18 | Bataan | Central Luzon | 256,890,000,000 | 853,373 | 301,029 |
| 19 | Bukidnon | Northern Mindanao | 248,750,000,000 | 1,541,308 | 161,389 |
| 20 | Zamboanga del Sur (incl. Zamboanga City) | Zamboanga Peninsula | 241,000,000,000 | 2,027,902 | 118,842 |
| 21 | Benguet (incl. Baguio) | Cordillera | 233,810,000,000 | 827,041 | 282,707 |
| 22 | Camarines Sur | Bicol Region | 194,840,000,000 | 2,068,244 | 94,206 |
| 23 | Tarlac | Central Luzon | 193,290,000,000 | 1,503,456 | 128,564 |
| 24 | Isabela | Cagayan Valley | 188,890,000,000 | 1,697,050 | 111,305 |
| 25 | Palawan (incl. Puerto Princesa) | Mimaropa | 180,320,000,000 | 1,246,673 | 144,641 |
| 26 | Bohol | Central Visayas | 171,090,000,000 | 1,394,329 | 122,704 |
| 27 | Davao del Norte | Davao Region | 168,610,000,000 | 1,125,057 | 149,868 |
| 28 | Negros Oriental | Central Visayas | 166,460,000,000 | 1,432,990 | 116,163 |
| 29 | Cagayan | Cagayan Valley | 148,780,000,000 | 1,268,603 | 117,279 |
| 30 | Albay | Bicol Region | 145,130,000,000 | 1,374,768 | 105,567 |
| 31 | Zambales (incl.Olongapo) | Central Luzon | 140,630,000,000 | 909,932 | 154,550 |
| 32 | Lanao del Norte (incl. Iligan) | Northern Mindanao | 136,850,000,000 | 1,086,017 | 126,011 |
| 33 | Cotabato | Soccsksargen | 120,350,000,000 | 1,490,618 | 80,738 |
| 34 | Misamis Occidental | Northern Mindanao | 119,380,000,000 | 617,333 | 193,380 |
| 35 | La Union | Ilocos Region | 118,600,000,000 | 822,352 | 144,220 |
| 36 | Zamboanga del Norte | Zamboanga Peninsula | 114,620,000,000 | 1,047,455 | 109,427 |
| 37 | Oriental Mindoro | Mimaropa | 109,400,000,000 | 908,339 | 120,440 |
| 38 | Agusan del Norte (incl. Butuan) | Caraga | 96,070,000,000 | 760,413 | 126,339 |
| 39 | Ilocos Norte | Ilocos Region | 93,100,000,000 | 609,588 | 152,726 |
| 40 | Davao de Oro | Davao Region | 93,100,000,000 | 767,547 | 121,296 |
| 41 | Ilocos Sur | Ilocos Region | 90,240,000,000 | 706,009 | 127,817 |
| 42 | Masbate | Bicol Region | 80,180,000,000 | 908,920 | 88,215 |
| 43 | Surigao del Norte | Caraga | 78,380,000,000 | 534,636 | 146,604 |
| 44 | Maguindanao del Norte | Bangsamoro | 78,010,000,000 | 943,500 | 82,682 |
| 45 | Sorsogon | Bicol Region | 74,560,000,000 | 828,655 | 89,977 |
| 46 | Capiz | Western Visayas | 74,380,000,000 | 804,952 | 92,403 |
| 47 | Agusan del Sur | Caraga | 74,220,000,000 | 739,367 | 100,383 |
| 48 | Lanao del Sur | Bangsamoro | 71,790,000,000 | 1,195,518 | 60,049 |
| 49 | Sultan Kudarat | Soccsksargen | 71,510,000,000 | 854,052 | 83,730 |
| 50 | Antique | Western Visayas | 70,690,000,000 | 612,974 | 115,323 |
| 51 | Aklan | Western Visayas | 63,570,000,000 | 615,475 | 103,286 |
| 52 | Surigao del Sur | Caraga | 63,190,000,000 | 642,255 | 98,388 |
| 53 | Zamboanga Sibugay | Zamboanga Peninsula | 60,390,000,000 | 669,840 | 90,156 |
| 54 | Camarines Norte | Bicol Region | 60,200,000,000 | 629,699 | 95,601 |
| 55 | Samar | Eastern Visayas | 57,860,000,000 | 793,183 | 72,947 |
| 56 | Nueva Vizcaya | Cagayan Valley | 57,790,000,000 | 497,432 | 116,177 |
| 57 | Davao Oriental | Davao Region | 55,450,000,000 | 576,343 | 96,210 |
| 58 | Occidental Mindoro | Mimaropa | 52,560,000,000 | 525,354 | 100,047 |
| 59 | Sarangani | Soccsksargen | 47,960,000,000 | 558,946 | 85,804 |
| 60 | Sulu | Bangsamoro | 44,970,000,000 | 1,000,108 | 44,965 |
| 61 | Northern Samar | Eastern Visayas | 44,340,000,000 | 639,186 | 69,369 |
| 62 | Southern Leyte | Eastern Visayas | 43,010,000,000 | 429,573 | 100,123 |
| 63 | Maguindanao del Sur | Bangsamoro | 38,230,000,000 | 723,758 | 52,822 |
| 64 | Davao Occidental | Davao Region | 37,900,000,000 | 317,159 | 119,498 |
| 65 | Basilan (incl. Isabela) | Bangsamoro | 34,240,000,000 | 556,586 | 61,518 |
| 66 | Eastern Samar | Eastern Visayas | 33,990,000,000 | 477,168 | 71,233 |
| 67 | Aurora | Central Luzon | 33,990,000,000 | 235,750 | 139,597 |
| 68 | Romblon | Mimaropa | 29,030,000,000 | 308,985 | 93,953 |
| 69 | Catanduanes | Bicol Region | 28,800,000,000 | 271,879 | 105,929 |
| 70 | Kalinga | Cordillera | 27,130,000,000 | 229,570 | 118,177 |
| 71 | Ifugao | Cordillera | 25,770,000,000 | 207,498 | 124,194 |
| 72 | Tawi-Tawi | Bangsamoro | 24,780,000,000 | 440,276 | 56,283 |
| 73 | Abra | Cordillera | 24,570,000,000 | 250,985 | 97,894 |
| 74 | Marinduque | Mimaropa | 21,650,000,000 | 239,207 | 90,507 |
| 75 | Quirino | Cagayan Valley | 21,140,000,000 | 203,828 | 103,715 |
| 76 | Biliran | Eastern Visayas | 16,190,000,000 | 179,312 | 90,290 |
| 77 | Guimaras | Western Visayas | 16,130,000,000 | 187,842 | 85,870 |
| 78 | Mountain Province | Cordillera | 14,890,000,000 | 158,200 | 94,121 |
| 79 | Siquijor | Central Visayas | 12,020,000,000 | 103,395 | 116,253 |
| 80 | Dinagat Islands | Caraga | 12,000,000,000 | 128,117 | 93,664 |
| 81 | Apayao | Cordillera | 11,500,000,000 | 124,366 | 92,469 |
| 82 | Camiguin | Northern Mindanao | 11,100,000,000 | 92,808 | 119,602 |
| 83 | Batanes | Cagayan Valley | 4,570,000,000 | 18,831 | 242,685 |
Source: Philippine Statistics Authority[116]
City accounts
Figures below are Provincial Product Accounts (PPA) for Highly Urbanized Cities (HUC) or Independent Cities. No data available for cities within Metro Manila.
| # | City | Province | Region | Island
Group |
2022 PPA GDP
(PHP) |
2020
Popn. |
PPA GDP
per Capita (PHP) |
|---|---|---|---|---|---|---|---|
| 1 | Davao City | Davao del Sur | Davao Region | Mindanao | 495,310,000,000 | 1,776,949 | 278,742 |
| 2 | Cebu City | Cebu | Central Visayas | Visayas | 288,640,000,000 | 964,169 | 299,367 |
| 3 | Cagayan de Oro | Misamis Oriental | Northern Mindanao | Mindanao | 261,780,000,000 | 728,402 | 359,389 |
| 4 | Baguio | Benguet | Cordillera | Luzon | 155,030,000,000 | 366,358 | 423,165 |
| 5 | Lapu-Lapu | Cebu | Central Visayas | Visayas | 151,420,000,000 | 497,604 | 304,298 |
| 6 | Iloilo City | Iloilo | Western Visayas | Visayas | 145,050,000,000 | 457,626 | 316,962 |
| 7 | Zamboanga City | Zamboanga del Sur | Zamboanga Peninsula | Mindanao | 139,470,000,000 | 977,234 | 142,719 |
| 8 | Bacolod | Negros Occidental | Western Visayas | Visayas | 132,810,000,000 | 600,783 | 221,062 |
| 9 | Angeles | Pampanga | Central Luzon | Luzon | 132,420,000,000 | 462,928 | 286,049 |
| 10 | General Santos | South Cotabato | Soccsksargen | Mindanao | 129,020,000,000 | 697,315 | 185,024 |
| 11 | Mandaue | Cebu | Central Visayas | Visayas | 109,580,000,000 | 364,116 | 300,948 |
| 12 | Iligan | Lanao del Norte | Northern Mindanao | Mindanao | 77,020,000,000 | 363,115 | 212,109 |
| 13 | Butuan | Agusan del Norte | Caraga | Mindanao | 57,370,000,000 | 372,910 | 153,844 |
| 14 | Puerto Princesa | Palawan | Mimaropa | Luzon | 53,080,000,000 | 307,079 | 172,855 |
| 15 | Olongapo | Zambales | Central Luzon | Luzon | 52,260,000,000 | 260,317 | 200,755 |
| 16 | Tacloban | Leyte | Eastern Visayas | Visayas | 51,530,000,000 | 251,881 | 204,581 |
| 17 | Lucena | Quezon | Calabarzon | Luzon | 46,620,000,000 | 278,924 | 167,142 |
| 18 | Isabela | Basilan | Bangsamoro | Mindanao | 11,760,000,000 | 130,379 | 90,199 |
source: Philippine Statistics Authority[116]
International comparisons

Statistics
Error: Image is invalid or non-existent.
| 2025 | 2024 | 2023 | 2022 | 2021 | 2020 | 2019 | 2018 | 2017 | |
|---|---|---|---|---|---|---|---|---|---|
| Social Indicators | |||||||||
| Population (in million) |
113.9 | 112.9 | 111.9 | 110.9 | 110.1 | 109.2 | 107.3 | 105.8 | 104.2 |
| Poverty (%) | 9.7 | - | 15.5 | - | 18.1 | - | - | 16.6 | - |
| Labor Force (in million) |
51.8 | 51.3 | 51.1 | 49.0 | 47.7 | 43.9 | 42.4 | 41.2 | 40.3 |
| Unemployment (%) | 4.2 | 3.8 | 4.4 | 5.4 | 7.8 | 10.3 | 5.1 | 5.3 | 5.7 |
| Wage Rates (Nominal ₱: end-of-period) |
695.00 | 645.00 | 610.00 | 570.00 | 537.00 | 537.00 | 537.00 | 537.00 | 512.00 |
| Inflation Rate (Constant 2018 prices; %) |
1.7 | 3.2 | 6.0 | 5.8 | 3.9 | 2.4 | 2.4 | 5.2 | 2.9 |
| External Sectors | |||||||||
| Trade Balance (US$ million) |
-66,670 | -68,744 | -66,306 | -69,701 | -52,806 | -33,775 | -49,312 | -50,972 | -40,215 |
| Export of Goods (US$ million) |
63,411 | 55,012 | 55,257 | 57,710 | 54,228 | 48,212 | 53,477 | 51,977 | 51,814 |
| Import of Goods (US$ million) |
130,081 | 125,394 | 121,292 | 127,412 | 107,034 | 81,987 | 102,788 | 102,949 | 92,029 |
| Current Account (US$ million; % of GDP) |
-16,291 (-3.3) | -17,512 (-3.8) | -12,387 (-2.8) | -18,261 (-4.5) | -5,943 (-1.5) | 11,578 (3.2) | -3,047 (0.8) | -8,877 (-2.6) | -2,143 (-0.7) |
| External Debt (US$ million; % of GDP) |
147,651 (30.3) | 137,628 (29.8) | 125,394 (28.7) | 111,268 (27.5) | 106,428 (27.0) | 98,488 (27.2) | 83,618 (22.2) | 78,960 (22.8) | 73,098 (22.3) |
| Personal Remittances (US$ million) |
39,619 | 38,341 | 37,210 | 36,136 | 34,884 | 33,194 | 33,467 | 32,213 | 31,288 |
| Foreign Reserves (US$ million) |
110,814 | 106,234 | 103,725 | 96,130 | 108,794 | 110,115 | 87,836 | 79,189 | 81,567 |
| FDI Flows (Inward; US$ million) |
9,003 | 9,448 | 6,452 | 5,939 | 10,255 | 6,822 | 8,671 | 9,949 | 10,236 |
| FDI Stock (Inward; US$ million) |
134,574 | 125,522 | 118,856 | 109,622 | 108,049 | 103,193 | 94,593 | 82,997 | 73,016 |
| Public Finances | |||||||||
| Budget Balance (₱ billion; % of GDP) |
-1,577 (-5.6) | -1,506 (-5.7) | -1,512 (-6.2) | -1,614 (-7.3) | -1,670 (-8.6) | -1,371 (-7.6) | -660 (-3.4) | -558 (-3.1) | -351 (-2.1) |
| Revenues (₱ billion; % of GDP) |
4,453 (15.9) | 4,419 (16.7) | 3,824 (15.7) | 3,546 (16.1) | 3,006 (15.5) | 2,856 (15.9) | 3,137 (16.1) | 2,850 (15.6) | 2,473 (14.9) |
| Expenditures (₱ billion; % of GDP) |
6,030 (21.5) | 5,925 (22.4) | 5,336 (21.9) | 5,160 (23.4) | 4,676 (24.1) | 4,227 (23.5) | 3,798 (19.5) | 3,408 (18.7) | 2,824 (17.1) |
| BSP Rates (Nominal; O-RRP) |
5.23 | 6.33 | 6.16 | 3.07 | 2.00 | 2.73 | 4.41 | 3.63 | 3.00 |
| Public Debt (₱ billion; % of GDP) |
17,708 (63.2) | 16,051 (60.7) | 14,616 (60.1) | 13,419 (60.9) | 11,729 (60.4) | 9,795 (54.6) | 7,731 (39.6) | 7,293 (39.9) | 6,652 (40.2) |
| Peso-Dollar Rate (Average Period) |
57.505 | 57.291 | 55.630 | 54.478 | 49.225 | 49.624 | 51.796 | 52.661 | 50.404 |
| Sources: Bangko Sentral ng Pilipinas[6] and UNCTAD[20] | |||||||||
GDP-related data can be found here:
- Industries: electronics assembly, aerospace, agribusiness, automotive, IT and business process outsourcing, shipbuilding, garments, footwear, pharmaceuticals, chemicals, wood products, financial services, food processing, petrochemical, metalcasting and mining, real estate, textile, tourism[15][16]
- Electricity – production: 106,115 GWh (2021)[130]
- Agriculture – products: abaca, bananas, sugarcane, coconuts, durian, rice, corn, cassavas, mangoes; pork, eggs, beef, pineapples, fish[131]
- Exports – commodities/products: Semiconductors and electronic products, machinery, transport equipment, aerospace/parts, automotive/parts, garments, chemicals, copper, nickel, petroleum products, coconut oil, fruits[131]
- Imports – commodities/products: electronic products, machinery, telecommunication and transport equipment, automotive, chemicals, petroleum, cereals, livestocks, cement and steel, fruits[131]
- Manufacturing Growth: 5.9% (April 2024)[132]
- PMI Manufacturing: 52.2 (April 2024)[133]
- Yield Curve: 10-Year Bond 6.70% (June 2024)[134]
- Net International Investment Position: –$51.317 billion (2023 est.)[135]
Government budget
The national government budget for 2025 has set the following budget allocations:[136][note 2]
| Budget allocation | (PHP, billions) | (USD, billions) | Difference from F.Y. 2024 |
|---|---|---|---|
| Department of Education | 977.6 | 16.78 | Increase 0.89% |
| Department of Public Works and Highways | 900.0 | 15.44 | Decrease 10.88% |
| Department of Health | 297.6 | 5.11 | Decrease 0.36% |
| Department of the Interior and Local Government | 278.4 | 4.78 | Increase 5.33% |
| Department of National Defense | 256.1 | 4.39 | Increase 6.05% |
| Department of Social Welfare and Development | 230.1 | 3.95 | Decrease 0.78% |
| Department of Agriculture | 211.3 | 3.60 | Decrease 0.49% |
| Department of Transportation | 180.9 | 3.10 | Decrease 59.15% |
| The Judiciary | 63.6 | 1.09 | Increase 5.35% |
| Department of Labor and Employment | 40.6 | 0.70 | Increase 5.91% |
History
The Philippine economy has been growing steadily over decades and the International Monetary Fund in 2014 reported it as the 39th largest economy in the world. The Philippines posted a high GDP growth rate of 7.6 percent in 2022.[137] However, the country is not a part of the Group of 20 nations; instead, it is grouped in a second tier for emerging markets or newly industrialized countries.
Notes for economic growth (1980–2023):
1980-82: Slower economic growth due to mismanagement
1983-86: Recession due to factors like corruption
1987-90: Recovery from 1984 crisis
1991-1992: Inflation and natural disasters (notably Mount Pinatubo eruption) caused slower growth
1993-97: Fast growth
1998: Minor recession due to the 1997 Asian financial crisis
1999-2001: Recovery
2002: Recession due to the EDSA II Protest
2002-2008: Post-EDSA II recovery
2009: Effects of the Great Recession
2010-2019: Philippines as a Tiger Economy
2020: Coronavirus Outbreak
2021-2023: Rebound
A chart below outlines selected statistics showing trends in the gross domestic product of the Philippines using data taken from the International Monetary Fund.[138][139]
- Indicates economic growth
- Indicates contraction / recession
- Indicates IMF forecast
| Year | GDP
(in Bil. US$PPP) |
GDP per capita
(in US$PPP) |
GDP
(in Bil. PHP nominal) |
GDP
(in US$nominal) |
GDP per capita
(in US$nominal) |
GDP growth
(real)[b] |
PHP:USD exchange rate[c][140] |
|---|---|---|---|---|---|---|---|
| 2025[141] | 1,479.4 Increase | 12,934 Increase | 28,502 Increase | 497.5 Increase | 4,349 Increase | 4.40% | Negative increase 58.805 |
| 2024[142] | 1,391.8 Increase | 12,191 Increase | 26,546 Increase | 471.5 Increase | 4,130 Increase | 5.70% | Negative increase 58.014 |
| 2023 | 1,278.6 Increase | 11,326 Increase | 24,276 Increase | 436.6 Increase | 3,720 Increase | 5.60% | Positive decrease 55.567 |
| 2022 | 1,173.1 Increase | 10,512 Increase | 22,023 Increase | 404.3 Increase | 3,623 Increase | 7.76% | Negative increase 56.120 |
| 2021 | 994.6 Increase | 9,043 Increase | 19,390 Increase | 393.7 Increase | 3,579 Increase | 5.60% | Negative increase 50.774 |
| 2020[d] | 919.2 Decrease | 8,389 Decrease | 17,937.6 Decrease | 361.5 Decrease | 3,298 Decrease | −9.50% | Positive decrease 48.036 |
| 2019 | 1,005 Increase | 9,295 Increase | 19,514.4 Increase | 376.8 Increase | 3,485 Increase | 6.00% | Positive decrease 50.744 |
| 2018 | 930.0 Increase | 8,720 Increase | 18,262.4 Increase | 346.8 Increase | 3,251 Increase | 6.30% | Negative increase 52.724 |
| 2017 | 854.0 Increase | 8,120 Increase | 15,556.4 Increase | 328.5 Increase | 3,123 Increase | 6.70% | Negative increase 49.923 |
| 2016 | 798.6 Increase | 7,703 Increase | 15,133.5 Increase | 318.6 Increase | 3,073 Increase | 6.90% | Negative increase 49.813 |
| 2015[143] | 741.0 Increase | 6,547 Decrease | 13,307.3 Increase | 292.4 Increase | 2,863 Increase | 5.80% | Negative increase 47.166 |
| 2014[143] | 642.8 Increase | 6,924 Increase | 12,645.3 Increase | 284.8 Increase | 2,844 Increase | 6.10% | Negative increase 44.617 |
| 2013[144] | 454.3 Increase | 4,660 Increase | 11,546.1 Increase | 272.2 Increase | 2,792 Increase | 7.20% | Negative increase 44.414 |
| 2012[145] | 419.6 Increase | 4,380 Increase | 10,564.9 Increase | 250.2 Increase | 2,611 Increase | 6.80% | Positive decrease 41.192 |
| 2011 | 386.1 Increase | 4,098 Increase | 9,706.3 Increase | 224.1 Increase | 2,379 Increase | 3.60% | Negative increase 43.928 |
| 2010 | 365.3 Increase | 3,945 Increase | 9,003.5 Increase | 199.6 Increase | 2,155 Increase | 7.63% | Positive decrease 43.885 |
| 2009 | 335.4 Increase | 3,685 Increase | 8,026.1 Increase | 168.5 Decrease | 1,851 Decrease | 1.15% | Positive decrease 46.356 |
| 2008 | 329.0 Increase | 3,636 Increase | 7,720.9 Increase | 173.6 Increase | 1,919 Increase | 4.15% | Negative increase 47.485 |
| 2007 | 309.9 Increase | 3,493 Increase | 6,892.7 Increase | 149.4 Increase | 1,684 Increase | 7.12% | Positive decrease 41.401 |
| 2006 | 283.5 Increase | 3,255 Increase | 6,271.2 Increase | 122.2 Increase | 1,405 Increase | 5.24% | Positive decrease 49.132 |
| 2005 | 261.0 Increase | 3,061 Increase | 5,677.8 Increase | 103.1 Increase | 1,209 Increase | 4.78% | Positive decrease 53.067 |
| 2004 | 242.7 Increase | 2,905 Increase | 5,120.4 Increase | 91.4 Increase | 1,093 Increase | 6.70% | Negative increase 56.267 |
| 2003 | 222.7 Increase | 2,720 Increase | 4,548.1 Increase | 83.9 Increase | 1,025 Increase | 4.97% | Negative increase 55.569 |
| 2002 | 207.8 Increase | 2,591 Increase | 4,198.3 Increase | 81.4 Increase | 1,014 Increase | 3.65% | Negative increase 53.096 |
| 2001 | 197.3 Increase | 2,511 Increase | 3,888.8 Increase | 76.3 Decrease | 971 Decrease | 2.89% | Negative increase 51.404 |
| 2000 | 187.5 Increase | 2,437 Increase | 3,580.7 Increase | 81.0 Decrease | 1,053 Decrease | 4.41% | Negative increase 49.998 |
| 1999 | 175.8 Increase | 2,352 Increase | 3,244.2 Increase | 83.0 Increase | 1,110 Increase | 3.08% | Negative increase 40.313 |
| 1998 | 168.1 Increase | 2,297 Decrease | 2,952.8 Increase | 73.8 Decrease | 1,009 Decrease | −0.58% | Positive decrease 39.059 |
| 1997 | 167.1 Increase | 2,336 Increase | 2,688.7 Increase | 92.8 Decrease | 1,297 Decrease | 5.19% | Negative increase 39.975 |
| 1996 | 156.1 Increase | 2,232 Increase | 2,406.4 Increase | 93.5 Increase | 1,336 Increase | 5.85% | Negative increase 26.288 |
| 1995 | 144.8 Increase | 2,118 Increase | 2,111.7 Increase | 83.7 Increase | 1,224 Increase | 4.68% | Negative increase 26.214 |
| 1994 | 135.5 Increase | 2,007 Increase | 1,875.7 Increase | 71.0 Increase | 1,052 Increase | 4.39% | Positive decrease 24.418 |
| 1993 | 127.1 Increase | 1,929 Increase | 1,633.6 Increase | 60.2 Increase | 914 Increase | 2.12% | Negative increase 27.699 |
| 1992 | 121.8 Increase | 1,891 Increase | 1,497.5 Increase | 58.7 Increase | 912 Increase | 0.34% | Positive decrease 25.096 |
| 1991 | 118.6 Increase | 1,882 Increase | 1,379.9 Increase | 50.2 Increase | 797 Increase | −0.49% | Positive decrease 26.650 |
| 1990 | 115.2 Increase | 1,873 Increase | 1,190.5 Increase | 48.9 Increase | 796 Increase | 3.04% | Negative increase 28.000 |
| 1989 | 107.6 Increase | 1,791 Increase | 1,025.3 Increase | 47.3 Increase | 786 Increase | 6.21% | Negative increase 22.440 |
| 1988 | 97.6 Increase | 1,663 Increase | 885.5 Increase | 42.0 Increase | 715 Increase | 6.75% | Negative increase 21.335 |
| 1987 | 88.4 Increase | 1,540 Increase | 756.5 Increase | 36.8 Increase | 641 Increase | 4.31% | Negative increase 20.800 |
| 1986 | 82.4 Increase | 1,471 Increase | 674.6 Increase | 33.1 Decrease | 591 Decrease | 3.42% | Negative increase 20.530 |
| 1985 | 77.9 Decrease | 1,426 Decrease | 633.6 Increase | 34.1 Decrease | 623 Decrease | −7.30% | Positive decrease 19.032 |
| 1984 | 81.6 Decrease | 1,530 Decrease | 581.1 Increase | 34.8 Decrease | 652 Decrease | −7.31% | Negative increase 19.760 |
| 1983 | 84.9 Increase | 1,630 Increase | 408.9 Increase | 36.8 Decrease | 707 Decrease | 1.88% | Negative increase 14.002 |
| 1982 | 80.1 Increase | 1,578 Increase | 351.4 Increase | 41.1 Increase | 810 Increase | 3.62% | Negative increase 9.171 |
| 1981 | 72.9 Increase | 1,471 Increase | 312.0 Increase | 39.5 Increase | 797 Increase | 3.42% | Negative increase 8.200 |
| 1980 | 64.4 Increase | 1,334 Increase | 270.1 Increase | 35.9 Increase | 744 Increase | 5.15% | Negative increase 7.600 |
| 1979 | 5.60% | Negative increase 7.415 | |||||
| 1978 | 5.20% | Negative increase 7.375 | |||||
| 1977 | 5.60% | Positive decrease 7.370 | |||||
| 1976 | 8.00% | Positive decrease 7.428 | |||||
| 1975 | 6.40% | Negative increase 7.498 | |||||
| 1974 | 5.00% | Negative increase 7.065 | |||||
| 1973 | 9.20% | Positive decrease 6.730 | |||||
| 1972 | 4.80% | Negative increase 6.781 | |||||
| 1971 | 4.90% | Negative increase 6.435 | |||||
| 1970 | 4.60% | Negative increase 6.435 | |||||
| |||||||
See also
- List of largest companies in the Philippines
- List of regions of the Philippines by GDP
- List of special economic zones in the Philippines
- Bamboo network
- Tiger Cub Economies
- Corruption in the Philippines
- Maharlika Wealth Fund
References
- ↑ 1.0 1.1 1.2 WORLD ECONOMIC OUTLOOK: Global Economy in the Shadow of War (PDF). International Monetary Fund (Report). p. 123. Retrieved April 30, 2026.
- ↑ "World Bank: Country and Lending Groups".
- ↑ Mapa, Dennis (July 17, 2025). "2024 Census of Population (POPCEN) Population Counts Declared Official by the President". Philippine Statistics Authority. Retrieved May 10, 2026.
- ↑ 4.0 4.1 4.2 4.3 "IMF: Data Explorer". International Monetary Fund. Retrieved April 30, 2026.
- ↑ "GDP per capita growth (annual %), World Bank Group, accessed July 2026".
- ↑ 6.00 6.01 6.02 6.03 6.04 6.05 6.06 6.07 6.08 6.09 "PHILIPPINES: SELECTED ECONOMIC AND FINANCIAL INDICATORS" (PDF). Bangko Sentral ng Pilipinas. Archived (PDF) from the original on March 27, 2026.
- ↑ Mapa, Dennis. "Summary Inflation Report Consumer Price Index (2018=100): August 2026". Philippine Statistics Authority. Retrieved September 4, 2026.
- ↑ Mapa, Dennis. "Proportion of Poor Families Reduced to 6.4 Percent in 2025". Philippine Statistics Authority. Retrieved August 21, 2026.
- ↑ "Poverty headcount ratio at $4.20 a day (2021 PPP) (% of population) - Philippines". World Bank. Retrieved November 3, 2019.
- ↑ GINI Report - Philippines (Report). World Bank Group.
- ↑ 11.0 11.1 Human Development Report 2025 - A matter of choice: People and possibilities in the age of AI (PDF) (Report). United Nations Development Programme. p. 289. Archived (PDF) from the original on May 6, 2025.
- ↑ 12.0 12.1 12.2 Mapa, Dennis. "Number of Employed Persons Rose to 49.21 Million as Underemployment Declined in July 2026". Philippine Statistics Authority. Retrieved September 8, 2026.
- ↑ Mapa, Dennis. "Average Monthly Wage Rate of Time-Rated Workers on Full-Time Basis in the Philippines was at PhP 21,544 in 2024". Philippine Statistics Authority. Retrieved November 25, 2025.
- ↑ Mapa, Dennis. "The Country's Total Gross Saving in 2025 expands to PhP 8.40 trillion". Philippine Statistics Authority. Retrieved June 25, 2026.
- ↑ 15.0 15.1 "Manufacturing". Department of Trade and Industry. Archived from the original on February 25, 2023. Retrieved February 25, 2023.
- ↑ 16.0 16.1 "Census of Philippine Business and Industry (CPBI)". Philippine Statistics Authority.
- ↑ 17.0 17.1 "Philippines (PHL) Exports, Imports, and Trade Partners". The Observatory of Economic Complexity.
- ↑ 18.0 18.1 Del Prado, Divina Gracia. "International Merchandise Trade Statistics of the Philippines for Agricultural Commodities, 2025". Philippine Statistics Authority. Retrieved March 26, 2026.
- ↑ 19.0 19.1 19.2 19.3 Del Prado, Divina Gracia. "International Merchandise Trade Statistics of the Philippines 2025". Philippine Statistics Authority. Retrieved March 26, 2026.
- ↑ 20.0 20.1 20.2 World Investment Report 2026: Philippines (PDF) (Report). United Nations Conference on Trade and Development. Archived (PDF) from the original on July 7, 2026.
- ↑ 21.0 21.1 "Special Data Dissemination Standards, Economic and Financial Data for the Philippines". Bangko Sentral ng Pilipinas. Retrieved August 8, 2026.
- ↑ "PHILIPPINES: BALANCE OF PAYMENT". Bangko Sentral ng Pilipinas. Retrieved March 28, 2024.
- ↑ "Gross International Reserves". Bangko Sentral ng Pilipinas. Retrieved August 8, 2026.
- ↑ 2025 DEPDev Annual Report (PDF) (Report). Pasig: Department of Economy, Planning, and Development. June 2026. Retrieved August 28, 2026.[dead link]
- ↑ "PHL ODA portfolio tops $41B at end of 2025". BusinessWorld. Manila. July 13, 2026. Retrieved August 28, 2026.
- ↑ "Philippines: Japan Credit Rating Agency, Ltd" (PDF). JCR. Retrieved May 10, 2026.
- ↑ "Philippines Outlook Revised To Stable On External Adversities; 'BBB+' Rating Affirmed". S&P Global Ratings. Retrieved April 8, 2026.
- ↑ Moaje, Marita. "Moody's affirms PH's 'BAA2' investment-grade credit rating". Philippine News Agency. Retrieved August 23, 2024.
- ↑ "Philippines". Fitch Ratings. Retrieved May 22, 2023.
- ↑ "The World Bank in the Philippines". World Bank. Retrieved March 21, 2022.
- ↑ "High Growth Potential for U.S. Agricultural Exports to the Philippines". USDA Foreign Agricultural Service. June 8, 2022. Macroeconomic Perspective. Archived from the original on June 13, 2022. Retrieved August 9, 2023.
- ↑ "The Philippines: September 1999". World Trade Organization. September 20, 1999.
- ↑ ""The World in 2050."". PwC. Retrieved February 1, 2017.
- ↑ "Philippines poised to be 22nd biggest economy in the world by 2035 — CEBR". BusinessWorld. December 28, 2020. Archived from the original on May 20, 2022. Retrieved December 29, 2020.
- ↑ Cordero, Ted (March 19, 2024). "Philippines could be a $2-trillion economy in next decade —World Economic Forum". GMA Integrated News. Retrieved March 20, 2024.
- ↑ International Monetary Fund. "World Economic Outlook Database, October 2025". IMF. Retrieved December 20, 2025.
- ↑ World Bank. "Land area (sq. km) - Philippines, Vietnam, Thailand, Malaysia". The World Bank Group. Retrieved December 20, 2025.
- ↑ 2024 Provincial Product Accounts (PPA) - Economic Performance of Provinces and Highly Urbanized Cities (Report). Philippine Statistics Authority. December 2024. Retrieved December 20, 2025.
- ↑ "Philippines extends land leases to 99 years to attract foreign investors". Reuters. September 5, 2025. Retrieved October 2, 2025.
- ↑ "The Luzon Economic Corridor: Infrastructure and Strategic Growth". Department of Trade and Industry (DTI). May 2024. Retrieved December 20, 2025.
- ↑ Venzon, Iñigo (January 15, 2026). "Philippines becomes first country to put entire national budget on blockchain". YugaTech. Retrieved March 18, 2026.
- ↑ "Philippines", The World Factbook, Central Intelligence Agency, September 27, 2021, archived from the original on September 27, 2021, retrieved October 11, 2021
- ↑ 43.0 43.1 del Rosario, King. "MBA Buzz: More Funds in the Philippines". Globis. Archived from the original on April 7, 2014. Retrieved June 11, 2013.
- ↑ Starr, Kevin (June 22, 2011). Coast of Dreams. Knopf Doubleday Publishing Group. p. 159. ISBN 978-0-307-79526-7.
- ↑ Gonzalez, Anna Leah (February 17, 2025). "Remittances from overseas Filipinos hit all-time high in 2024". Philippine News Agency. Retrieved May 10, 2026.
- ↑ "Employment situation as of December 2022". Philippine Statistics Authority (Press release). Retrieved February 8, 2023.
- ↑ "Agriculture shared (%) of the total GDP". Philippine Statistics Authority. Retrieved February 22, 2023.
- ↑ Behnassi, Mohamed; Gupta, Himangana; Baig, Mirza Barjees; Noorka, Ijaz Rasool (October 20, 2022). The Food Security, Biodiversity, and Climate Nexus. Springer Nature. p. 252. ISBN 978-3-031-12586-7. Retrieved March 3, 2023.
- ↑ Hayami, Yūjirō; Quisumbing, Maria Agnes R.; Adriano, Lourdes S. (1990). Toward an alternative land reform paradigm: a Philippine perspective. Ateneo de Manila University Press. p. 108. ISBN 978-971-11-3096-1. Retrieved November 15, 2011.
- ↑ "World pineapple production by Country". Statista. Retrieved September 27, 2020.
- ↑ "Top Producing Countries 2025/2026 Rice Production". USDA Foreign Agricultural Service. USDA Foreign Agricultural Service. Retrieved July 22, 2026.
- ↑ Narvaez-Soriano, Nora (1994). A Guide to Food Selection, Preparation and Preservation. Rex Book Store, Inc. p. 120. ISBN 978-971-23-0114-8. Retrieved March 11, 2023.
- ↑ "Top 10 Rice Farming Regions in the Philippines". Mindanao Times. January 30, 2022. Archived from the original on January 31, 2022. Retrieved April 25, 2023.
- ↑ Agoot, Liza (December 22, 2020). "PH logs highest rice production rate at 19.44M metric tons: DA". Philippine News Agency. Archived from the original on December 27, 2020. Retrieved April 25, 2023.
- ↑ "ESS Website ESS: Statistics home". Food and Agriculture Organization of the United Nations. Retrieved March 3, 2015.
- ↑ "Historical Statistics". Sugar Regulatory Administration. Archived from the original on December 9, 2022. Retrieved March 3, 2015.
- ↑ Master Plan For the Philippine Sugar Industry. Sugar Master Plan Foundation, Inc. 2010. p. 7.
- ↑ 58.0 58.1 Bian, Alice; Howai, Niko; Cayetano, Cristobal; Creencia, Lota; Gibb, Maxine; Robinson, Elizabeth (2026). Scaling up blue finance to support mangrove-based livelihoods in the Philippines (PDF) (Report). London School of Economics and Political Science. doi:10.21953/researchonline.lse.ac.uk.00138528.
- ↑ Howai, Niko (2019). "Provisioning services of mangroves". Grantham Research Institute on Climate Change and the Environment. Retrieved June 11, 2026.
- ↑ Howai, Niko; Bian, Alice; De Guzman-Mortiller, Arnica; Robinson, Elizabeth (May 20, 2026). Mangrove livelihoods in Palawan, Philippines: individual and joint household preferences with exemption interviews (PDF). Grantham Research Institute on Climate Change and the Environment Working Paper No. 448. London: London School of Economics and Political Science. doi:10.21953/researchonline.lse.ac.uk.00138521. ISSN 2515-5717.
- ↑ 61.0 61.1 Crismundo, Kris. "PH vehicle assemblers post record-high sales in 2024". Philippine News Agency. Retrieved January 14, 2025.
- ↑ Oslowski, Justin (March 25, 2003). "Automotive Production in the Philippines". Innovation, Science and Economic Development Canada. Archived from the original on December 8, 2007. Retrieved December 11, 2007.
- ↑ Panganiban, Ira (March 14, 2023). "Chinese cars and ride-hailing cars". The Manila Times. Archived from the original on March 14, 2023. Retrieved April 7, 2023.
- ↑ Tan, Alyssa Nicole O. (May 22, 2022). "Foton plans expansion with six new dealership locations". BusinessWorld. Archived from the original on May 22, 2022. Retrieved April 7, 2023.
- ↑ Bamber, Penny; Frederick, Stacey; Gereffi, Gary (May 2016). The Philippines in the Aerospace Global Value Chain. ResearchGate (Technical report). Duke University Center on Globalization, Governance and Competitiveness. pp. vi, 47, 50, 52, 54. Retrieved August 10, 2023.
- ↑ "Aerospace Industry supports RCEP". Philippine Information Agency. January 27, 2022. Retrieved March 3, 2023.
- ↑ Gatdula, Donnabelle (January 30, 2006). "TransCo installs 50-MVA transformer in Benguet". The Philippine Star. Archived from the original on April 23, 2023. Retrieved April 23, 2023.
- ↑ Chiu, Rey Anthony (July 13, 2007). "Intel Phils manager debunks negative perception". Philippine Information Agency (Press release). Archived from the original on April 23, 2023. Retrieved April 23, 2023.
- ↑ "Texas Instruments in Baguio retrenches 392 employees". C114 - China Communication Network. January 9, 2009. Archived from the original on July 6, 2010. Retrieved October 12, 2012.
- ↑ Osorio, Ma. Elisa (February 20, 2009). "Toshiba unit to expand RP operations". The Philippine Star. Archived from the original on November 26, 2020. Retrieved April 23, 2023.
- ↑ "Contact Lexmark". Lexmark Philippines. Archived from the original on December 6, 2022. Retrieved April 7, 2023.
- ↑ Reyes-Macasaquit, Mari-Len (2010). "4: Case Study of the Electronics Industry in the Philippines: Linkages and Innovation". In Intarakumnerd (ed.). Fostering Production and Science and Technology Linkages to Stimulates Innovation in ASEAN (PDF) (Report). Economic Research Institute for ASEAN and East Asia. pp. 146–147. Archived from the original (PDF) on August 19, 2019. Retrieved April 23, 2023.
- ↑ "Homepage |". Semiconductor and Electronics Industries in the Philippines Foundation. Archived from the original on September 20, 2023. Retrieved April 19, 2023.
- ↑ "Highlights of the 2022 Annual International Merchandise Trade Statistics of the Philippines". PSA (Press release). Archived from the original on August 3, 2023. Retrieved April 1, 2023.
- ↑ Promoting the Growth of the Semiconductor Ecosystem in the Philippines. OECD. December 9, 2024. doi:10.1787/01497fea-en. ISBN 978-92-64-33894-4. Retrieved December 22, 2025.
- ↑ "Semiconductor & Electronics Industries in the Philippines (SEIPI) Foundation, Inc". July 25, 2024. Retrieved December 22, 2025.
- ↑ "PHILIPPINE ELECTRONICS EXPORT PERFORMANCE DECEMBER 2023 - SEIPI". August 13, 2024. Retrieved December 22, 2025.
- ↑ Schneider, Keith (June 8, 2017). "The Philippines, a nation rich in precious metals, encounters powerful opposition to mining". Mongabay. Archived from the original on July 10, 2017. Retrieved July 18, 2020.
- ↑ Cinco, Maricar (June 3, 2016). "Firm sees metal costlier than gold in Romblon sea". Philippine Daily Inquirer. Archived from the original on July 24, 2020. Retrieved July 24, 2020.
- ↑ Teves, Catherine (December 11, 2020). "Total mineral product export earnings rise". Philippine News Agency. Archived from the original on December 13, 2020. Retrieved April 13, 2023.
- ↑ Conde, Carlos H. (December 3, 2004). "Court ruling in Philippines buoys mining sector there". The New York Times. Retrieved January 15, 2021.
- ↑ McRae, Michele E. (January 2021). Mineral Commodity Summaries: Nickel (PDF) (Report). United States Geological Survey. Archived from the original (PDF) on February 16, 2021.
- ↑ Shedd, Kim B. (January 2021). Mineral Commodity Summaries: Cobalt (PDF) (Report). United States Geological Survey. Archived from the original (PDF) on February 13, 2021.
- ↑ "Value of Philippines' Class A Gold, Copper, Nickel, and Chromite Reserves Amounted to PhP 588.12 Billion in 2025". Philippine Statistics Authority. Retrieved June 25, 2026.
- ↑ IBM Global Business Services. (October 2008). Global Location Trends – 2008 Annual Report[dead link]
- ↑ Balana, Cynthia D. and Lawrence de Guzman. (December 5, 2008). It's official: Philippines bests India as No. 1 in BPO Archived September 26, 2012, at the Wayback Machine. The Philippine Daily Inquirer.
- ↑ Garcia, Cathy Rose A. (March 21, 2012). "BPO industry to generate 100,000 jobs this year: WB". ABS-CBN News.
- ↑ Arenas, Guillermo; Coulibaly, Souleymane (November 14, 2022). A New Dawn for Global Value Chain Participation in the Philippines. World Bank Publications. p. 28–29. ISBN 978-1-4648-1848-6. Retrieved February 27, 2023.
- ↑ Philippine Economic Zone Authority."Information Technology Parks/Centers". Philippine Economic Zone Authority. Archived from the original on August 3, 2019. Retrieved July 4, 2019.
- ↑ "Bacolod still 'center of excellence' for IT-BPO". SunStar. July 2, 2020. Archived from the original on August 8, 2020. Retrieved April 27, 2023.
- ↑ "foreign companies eye local BPO sector". Philippine Daily Inquirer. Retrieved August 5, 2015.
- ↑ Friginal, Eric (2009). The Language of Outsourced Call Centers: A Corpus-based Study of Cross-cultural Interaction. John Benjamins Publishing. p. 17. ISBN 978-90-272-2308-1. Retrieved April 13, 2023.
- ↑ Snow, Donald M.; Haney, Patrick J. (August 2, 2017). U.S. Foreign Policy: Back to the Water's Edge. Rowman & Littlefield. p. 262. ISBN 978-1-4422-6818-0. Retrieved April 13, 2023.
- ↑ "The Philippines – Poised for Growth Through BPO". DCR TrendLine. April 1, 2015. Archived from the original on November 17, 2015. Retrieved November 10, 2015.
- ↑ Reyes, Daniel A. (November 27, 2013). The Philippine Shipbuilding Industry (PDF). Organisation for Economic Co-operation and Development (Report). Paris, France. Archived from the original (PDF) on September 10, 2015. Retrieved April 26, 2023.
- ↑ "Robust shipbuilding industry key to making PHL a maritime power". BusinessWorld. April 17, 2023. Archived from the original on April 17, 2023. Retrieved April 26, 2023.
- ↑ "Cebu shipbuilder to deliver PHs largest vessel". Philippine Daily Inquirer. Archived from the original on August 6, 2014. Retrieved March 3, 2015.
- ↑ "Registered Shipbuilding and Ship Repair Entity With Facilities, Manpower & Capitalization in Central Office (as of December 2017)" (PDF). Maritime Industry Authority. Archived from the original (PDF) on January 17, 2022. Retrieved August 9, 2023.
- ↑ "Philippines Shipbuilding Hub In Asia-Pacific". Manila Bulletin. December 4, 2012. Archived from the original on April 4, 2015. Retrieved March 3, 2015 – via Yahoo! News Philippines.
- ↑ UN Conference on Trade and Development annual report on shipbuilding, by country (2023). UN Conference on Trade and Development (Report).
- ↑ "New era as shipbuilding production begins in the Philippines". Shipping Times. Archived from the original on May 9, 2007. Retrieved March 3, 2015.
- ↑ Poole, William. "Big ambitions for Philippines shipbuilding". Baird Maritime. Archived from the original on April 2, 2015. Retrieved March 3, 2015.
- ↑ "Filipino firm invests P259M for shipyard in Navotas". BusinessMirror. Archived from the original on December 16, 2012. Retrieved January 12, 2013.
- ↑ "How shipbuilding contributes to PH economic growth". The Manila Times. March 19, 2022. Archived from the original on March 26, 2022. Retrieved April 26, 2023.
- ↑ "2022 POESA Infographics". PSA (Press release). Archived from the original on October 24, 2023.
- ↑ "Ocean-based industries grew by 21.1 Percent in 2022, Accounted for 3.9 Percent of GDP". PSA (Press release). Archived from the original on October 24, 2023.
- ↑ 107.0 107.1 Power Planning and Development Division, Electric Power Industry Management Bureau. 2019 Power Situation Report (PDF). Department of Energy (Report). p. 7. Retrieved February 19, 2023.
- ↑ The Report: Philippines 2016. Oxford Business Group. April 8, 2016. p. 122. ISBN 978-1-910068-55-7. Retrieved February 27, 2023.
- ↑ Overland, Indra; Sagbakken, Haakon Fossum; Chan, Hoy-Yen; Merdekawati, Monika; Suryadi, Beni; Utama, Nuki Agya; Vakulchuk, Roman (December 2021). "The ASEAN climate and energy paradox". Energy and Climate Change. 2 100019. doi:10.1016/j.egycc.2020.100019. hdl:11250/2734506.
- ↑ Series of Economic Fora Session 6: Energy Services and Renewable Energy in the New Normal. Department of the Interior and Local Government (Philippines), Center for Research and Communication.
- ↑ "DOE opens RE for full foreign ownership". Manila Bulletin. Retrieved November 16, 2022.
- ↑ Crismundo, Kris. "Danish firm investing $5-B for offshore wind projects in PH". Philippine News Agency. Retrieved March 30, 2023.
- ↑ "DOE to achieve renewable energy goals via reforms". Philippine News Agency. Retrieved February 3, 2023.
- ↑ Mapa, Claire Dennis S. (April 27, 2023). "All Economies of 17 Regions Continue to Record Positive Growths in 2022; Western Visayas was the Fastest Growing Region at 9.3 Percent" (PDF). Philippine Statistics Authority (Press release). Archived from the original (PDF) on April 27, 2023. Retrieved May 13, 2023.
- ↑ "Gross Regional Domestic Product". PSA OpenSTAT. Philippine Statistics Authority.
- ↑ 116.0 116.1 "Authentication challenge pages".
- ↑ "Economic Freedom of the World: 2023 Annual Report" Archived February 28, 2024, at the Wayback Machine Fraser Institute | Retrieved February 28, 2024.
- ↑ List of countries by past and projected GDP (PPP)
- ↑ List of countries by past and projected GDP (nominal)
- ↑ List of countries by GDP (PPP) per capita
- ↑ List of countries by GDP (nominal) per capita
- ↑ List of countries by foreign-exchange reserves
- ↑ "Index Data 2016". The Heritage Foundation. Archived from the original on February 7, 2016. Retrieved September 10, 2017.
- ↑ External Debt List of countries by external debt
- ↑ "Human Development Report 2021/2022" (PDF). United Nations Development Programme. Retrieved February 28, 2023.
- ↑ "The Global Competitiveness Report 2019" (PDF). World Economic Forum. Retrieved February 28, 2023.
- ↑ "Phl moves up in WEF Enabling Trade Index". The Philippine Star. Retrieved March 3, 2015.
- ↑ "The Financial Development Index 2012 rankings: Comparison with 2011" (PDF). World Economic Forum. Retrieved September 15, 2014.
- ↑ "Ease of Doing Business Report". Doing Business. The World Bank. Archived from the original on October 6, 2013. Retrieved September 28, 2013.
- ↑ 2021 Power Statistics (PDF). Department of Energy (Report).
- ↑ 131.0 131.1 131.2 CIA World Factbook, Philippines, Retrieved May 15, 2009.
- ↑ "Production Index and Net Sales Index (Monthly Integrated Survey of Selected Industries) April 2024 (2018=100)". Philippine Statistics Authority (Press release). Retrieved June 7, 2024.
- ↑ PHL S&P Global Philippines Manufacturing PMI. S&P Global (Report). Retrieved May 2, 2024.[permanent dead link]
- ↑ "PDEX FIXED INCOME (FI) MARKET SUMMARY". Bureau of the Treasury. Archived from the original on July 17, 2024. Retrieved June 20, 2024.
- ↑ "PHL-International Investment Position (BPM6)". Bangko Sentral ng Pilipinas. Retrieved October 1, 2022.
- ↑ "Briefer on the 2025 Proposed National Budget" (PDF). Department of Budget and Management. January 3, 2025. Retrieved May 10, 2026.
- ↑ Esmael, Lisbet (January 26, 2023). "Strongest since 1976: PH records 7.6% economic growth in 2022". CNN Philippines. Archived from the original on January 26, 2023. Retrieved March 18, 2023.
- ↑ 138.0 138.1 International Monetary Fund. (April 2012). World Economic Outlook Data, By Country – Philippines: [selected annual data for 1980–2017]. Retrieved 2012-06-23 from the World Economic Outlook Database.
- ↑ "World Economic Outlook (WEO) Database April 2010 – Report for Selected Countries and Subjects – Philippines and United States". International Monetary Fund. April 2010.
- ↑ "Historical Philippine Peso per US Dollar Exchange Rates". Bangko Sentral ng Pilipinas. Retrieved January 19, 2026.
- ↑ "International Monetary Fund". International Monetary Fund. Retrieved April 25, 2025.
- ↑ "World Economic Outlook Database, October 2024". International Monetary Fund. Retrieved January 11, 2025.
- ↑ 143.0 143.1 "National Accounts of the Philippines (NAP)". National Statistical Coordination Board. Archived from the original on November 13, 2012.
- ↑ "Report for Selected Countries and Subjects". International Monetary Fund. Retrieved March 3, 2015.
- ↑ "Report for Selected Countries and Subjects". International Monetary Fund. Imf.org. April 16, 2013. Retrieved April 19, 2013.
- ↑ International Monetary Fund. (October 2010). The Philippine Stock Exchange, It is one of the oldest stock exchanges in Southeast Asia, having been in continuous operation since its inception in 1927. It currently maintains two trading floors, one at the Ayala Tower One in the Makati Central Business District, and one at its headquarters in Pasig. The PSE is composed of a 15-man Board of Directors, chaired by Jose T. Pardo. World Economic Outlook Data, By Country – Philippines: [selected annual data for 1980–2015]. Retrieved 2011-01-31 from the World Economic Outlook Database.
- ↑ "The World Economic Outlook (WEO) Database April 2002 – Real Gross Domestic Product (annual percent change) – All countries". International Monetary Fund. April 2002.
- ↑ "Philippines: Selected Economic and Financial Indicators (2018=100)" (PDF). Bangko Sentral ng Pilipinas. Archived (PDF) from the original on March 6, 2023. Retrieved March 3, 2023.

Notes
Further reading
- Balisacan, Arsenio; Hal Hill (2003). The Philippine Economy: Development, Policies, and Challenges. New York: Oxford University Press. p. 496. ISBN 978-0-19-515898-4. Archived from the original on June 28, 2011.
- Balisacan, Arsenio; Hal Hill (2007). The Dynamics of Regional Development: The Philippines in East Asia (PDF). Cheltenham, UK: Edward Elgar. Archived from the original (PDF) on December 8, 2010.
- Bhagwati, Jagdish and Anne Krueger. (1974). Foreign Trade Regimes and Economic Development. National Bureau of Economic Research.
- Hawes, Gary, And Ruth T. Mcvey. (2018) "Marcos, His Cronies, and the Philippines' Failure to Develop." Southeast Asian Capitalists (Cornell University Press, 2018) pp. 145–160.
- Hutchcroft, Paul D. (1998). Booty Capitalism: The Politics of Banking in the Philippines. Cornell University Press. ISBN 978-1-5017-3863-0.
- Kang, David C. (2002). Crony Capitalism – Corruption and Development in South Korea and the Philippines. Cambridge University Press. ISBN 978-0-521-00408-4.
- Krinks, Peter. The economy of the Philippines: Elites, inequalities and economic restructuring (Routledge, 2003_.
- Villegas, Bernardo. (2010). The Philippine Advantage (3rd ed.). Manila: University of Asia and the Pacific.
- Yang, Lan, et al. "Can an island economy be more sustainable? A comparative study of Indonesia, Malaysia, and the Philippines." Journal of Cleaner Production 242 (2020): 118572.
- The Impact of Trade on Employment in the Philippines: Country Report (PDF). Makati City, Philippines: International Labour Organization. April 2019. ISBN 978-92-2-133021-9. Archived from the original (PDF) on January 24, 2022.
- State of the Philippine Islands (1821) online
- Philippines – Asia's new tiger economy
- Philippines' opportunity point
External links

- Bangko Sentral ng Pilipinas (Central Bank of the Philippines)
- Department of Trade and Industry
- Department of Finance Archived February 28, 2009, at the Wayback Machine
- Philippine Stock Exchange
- Department of Tourism
- Philippine Economic Zone Authority
- Trade

- Pages with non-numeric formatnum arguments
- All articles with dead external links
- Articles with dead external links from September 2026
- Articles with dead external links from May 2025
- CS1: unfit URL
- Articles with dead external links from July 2024
- Articles with permanently dead external links
- Wikipedia pages with incorrect protection templates
- Use mdy dates from January 2024
- Use Philippine English from January 2024
- All Wikipedia articles written in Philippine English
- Articles containing potentially dated statements from 2022
- All articles containing potentially dated statements
- Articles with unsourced statements from June 2011
- Articles with broken excerpts
- Articles containing potentially dated statements from 2021
- Commons category link is defined as the pagename
- Portal-inline template with redlinked portals
- Economy of the Philippines
- World Trade Organization member economies